TL;DR version:
IMHO, best chart controls available today on the market!
Now, for those who really wants to know what I mean:
We were working on a very large WPF project for our customer.
We had all sorts of requirements for charts: from a simple bars chart to a custom chart that shows us domain specific data.
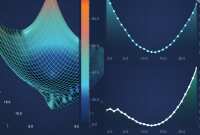
In addition, we had a chart that potentially had to show around 100K points in under 1 second. Moreover, the point is not a static sized point, but its size was changed by the metadata it held.
SciChart absolutely killed it!!!
A bit pros and cons,
Pros:
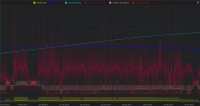
- Very fast rendering.
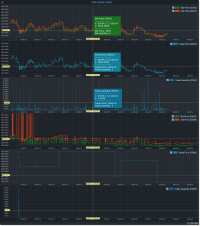
- Lots of features
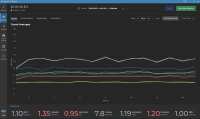
- Flexible! We had to change a lot of the default behaviors, and once you understand how SciChart works, it was pretty easy to do.
- Support. Let me say that again: SUPPORT! A lot of chart controls are great, but not a lot of chart controls have such a great support! No issue is too small for the support team. They are willing to help with any small question we had and made their best to help us with the big issues we had as well.
Cons:
- There are some bugs that we had to create workarounds for them. But since we had a very specific requirements, I believe most users won't face those bugs. Nevertheless, it something that I think was worth mentioning.
Bottom line,
The deadlines were tight and we wouldn't make it without SciChart controls.
I'd like to thank the guys from SciChart for doing such an awesome job! Keep it up!
6 years ago
SciChart Ltd has a
4.8
average rating
from
443
reviews
Book your activation call by clicking the button below. Or call us now on
+1 213-325-5109 .
Book a Call
Alice, Customer Support
Start Your Free Trial
Thank you! Now Check Your Email...
A member of our team wil be in contact shortly to discuss your existing contract and the next steps to take.
We've sent you a link to verify your free account. Click the 'VERIFY ACCOUNT' button in the email to complete activation and access your REVIEWS.io dashboard.
If you have any issues then please open chat to talk to a product specialist.